The latest EPA report presents compelling evidence that the composition of the atmosphere and many fundamental aspects of our climate in the United States are changing. These changes include rising air and water temperatures, heavy precipitation, frequent heat waves, and intense Atlantic hurricanes. Many observed climate changes are linked to rising levels of greenhouse gases in our atmosphere caused by human activities.
Climate change affects the environment in ways that significantly impact the health and well-being of people and ecosystems. For example, extreme heat days and heat waves increase as temperatures increase, putting people at greater risk for heat-related illnesses and deaths. Less snowpack and increased glacier melt affect water resources for both ecosystems and human use.
Changes in the timing and character of seasons affect the days suitable for growing crops and increase pollen that triggers seasonal allergies. These changes will not be experienced equally, as some communities have faced and will continue to face disproportionate impacts of climate change due to existing vulnerabilities, including socioeconomic disparities, historical patterns of inequity, and systemic environmental injustices.
Key Highlights from the Fifth Edition
On July 2, the United States Environmental Protection Agency released the Fifth Edition of Climate Change Indicators in the United States. The report highlights new data showing the continuing and far-reaching impacts of climate change on the people and environment of the United States. New to the report this year are indicators on Marine Heat Waves (showing trends related to multi-day high ocean temperatures) and a feature on Heat-Related Workplace Deaths.
“EPA’s Climate Change Indicators report is an authoritative resource of how the climate crisis is affecting every American right now and with increasing intensity,” said EPA Administrator Michael S. Regan. “Extreme heat, flooding, and wildfires have become more common, harming human health, threatening livelihoods, and causing costly damage. Regular updates to the data in the Climate Indicators website and report help us track these unprecedented changes so we are better informed in our shared work to confront the crisis.”
Detailed Observations and Trends
The Fifth Edition presents highlights from a subset of EPA’s total of 57 indicators, which include historical data and observed trends related to climate change causes or effects. EPA partners with more than 50 data contributors from various U.S. and international government agencies, academic institutions, and other organizations to compile these key indicators of climate change. The report explores the interconnected nature of observed changes in climate with chapters thematically organized around Greenhouse Gases, Heat on the Rise, Extreme Events, Water Resources at Risk, Changing Seasons, Ocean Impacts, Rising Seas, and Alaska’s Warming Climate. Since publishing the first edition in 2010, EPA has maintained an up-to-date online resource of climate change indicators and regularly released updated publications that present the latest data.
EPA’s indicators show multiple lines of compelling evidence that climate change increasingly affects people’s health, society, and ecosystems in numerous ways. For example:
- Global and U.S. Temperature: 2023 was the warmest year globally, with 2014–2023 the warmest decade. In the U.S., hot summer days and nights have become more common, warming nights faster.
- Heat Waves in U.S. Cities: Heat waves in major U.S. cities have increased from an average of two per year in the 1960s to six in the 2010s and 2020s. The heat wave season is now 46 days longer, with recent heat waves lasting about four days.
- Heat-Related Workplace Deaths: Between 1992 and 2022, 986 U.S. workers died from heat exposure, with the construction sector accounting for 34% of these deaths.
- Sea Surface Temperature: Over the past century, sea surface temperatures have risen, consistently higher in the past three decades than at any other time since 1880.
- Marine Heat Waves: From 1982 to 2023, marine heat waves have become more common, longer, and hotter, especially off the Northeastern U.S. and Alaskan coasts.
- Marine Species Distribution: Many marine species are moving northward to deeper waters due to warming oceans. Key species like American lobster and black sea bass have shifted northward by an average of 145 miles since the 1980s.
- Coastal Flooding: Tidal flooding along the U.S. coast has become more frequent since the 1950s, with floods now at least five times more common at many sites, particularly in Hawai’i and along the East and Gulf coasts.
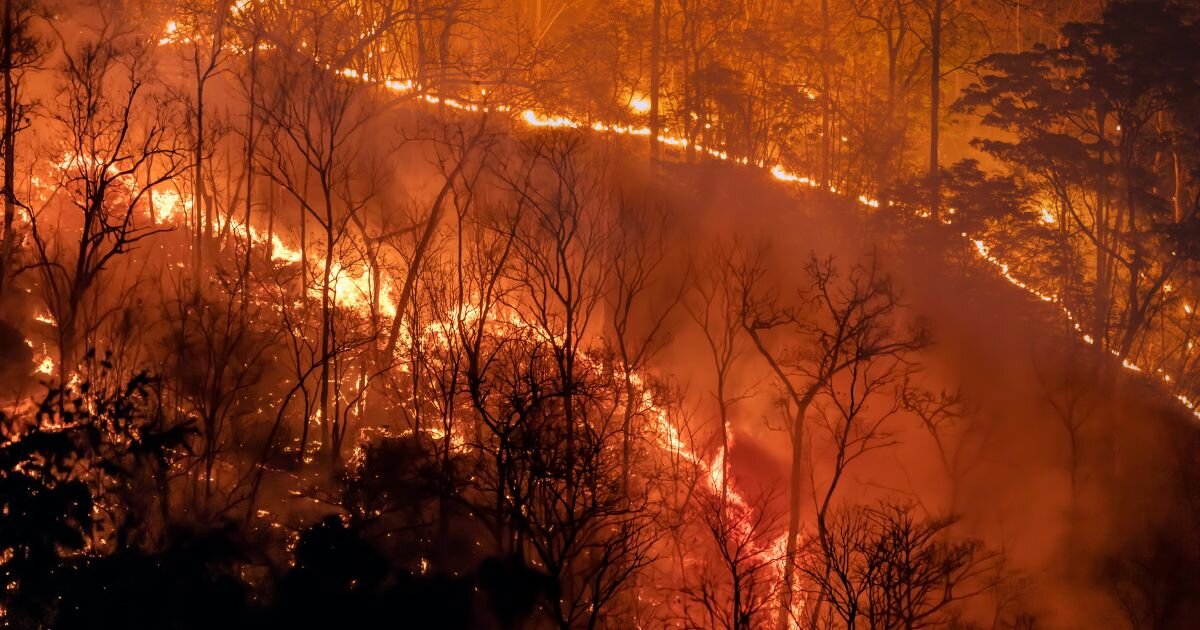
- Wildfires: The area burned by wildfires in the U.S. has increased since the 1980s, especially in the West and Southwest. The 10 years with the largest acreage burned have occurred since 2004.
- Length of the Growing Season: The growing season in the contiguous 48 states has lengthened by more than two weeks since the early 20th century, with significant increases in the West.
- Snowpack: From 1982 to 2023, the snowpack season shortened at 80% of measured sites, decreasing by an average of 15 days, with peak snowpack occurring nearly seven days earlier.
- Arctic Sea Ice: The September 2023 sea ice extent was the fifth smallest on record, 789,000 square miles below the 1981-2010 average. Since 1979, the Arctic melt season has grown by 37 days, with ice melting seven days earlier and refreezing 30 days later on average.
What Does This Mean For The Future?
Looking ahead, the EPA will continue working with other agencies, organizations, and individuals to maintain and improve the resources for climate change indicators. As new indicator data become available, the EPA plans to update the indicators online and explore additional indicators that can more comprehensively document climate change and its effects, including its disproportionate impacts. Identifying and analyzing indicators improves our understanding of climate change, validates projections of future change, and, importantly, assists the EPA in its efforts to slow climate change and adapt to its impacts.