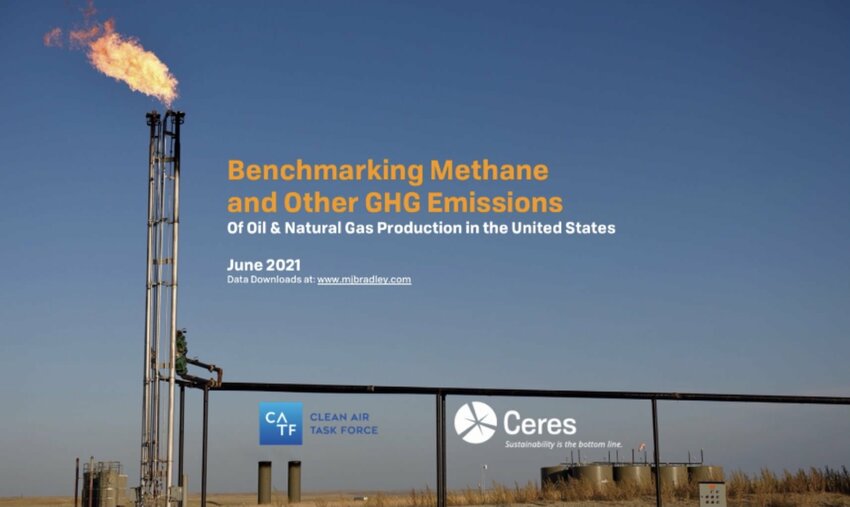
 (Credit: Ceres and the Clean Air Task Force)
A new analysis from Ceres and the Clean Air Task Force allows investors to directly compare oil and gas company emissions intensity and total reported emissions for US oil and gas producers. The analysis used publicly available data to develop comparable metrics that highlight the GHG performance of nearly 300 onshore oil and gas producers in the US.
The analysis reveals dramatic variability between companies and basins. Many small oil and gas operators have an outsized impact on total industry greenhouse gas emissions, for example: while 195 of the smallest producers collectively account for just 9% of production, they are responsible for 22% of total reported emissions, found the analysis. On the other hand, the sheer scale of production at major oil and gas companies makes for whopping emissions, with the top 11 producers in the US accounting for 25% of total reported GHG emissions.
Additionally, among even large producers, emissions vary substantially, with the highest emitter’s total GHG emissions being 14 times greater than the lowest emitter.
Oil and gas companies are being increasingly pushed by investors and other stakeholders to focus on reducing emissions intensity and reporting it in a consistent way: the Ceres analysis comes just a few weeks after 147 investors with more than $5.35 trillion in assets under management signed a statement announcing their concern about lost product and reputational risks and calling for stronger regulation. The new report indicates clearly that “one oil and gas company is not the same as another when it comes to production emissions,” says Andrew Logan, senior director of oil and gas at Ceres.“The oil and gas companies that minimize and most effectively manage their emissions will be best positioned to survive the transition to a net-zero emissions future.”
Stakeholder engagement with the industry — and the industry’s ability to benchmark its own performance — has been stymied by a lack of clear and consistently calculated metrics, forcing stakeholders to rely on voluntary metrics reported by companies that are often incomplete or non-comparable. The analysis — gathered by M.J. Bradley & Associates using data that companies are required to submit to the EPA in compliance with the Greenhouse Gas Reporting Program —can help investors make more informed decisions, the authors say. The report’s data tool allows users to directly compare emissions intensity and total reported emissions for US oil and gas producers, filtering by basin, company or class of company (top 100, etc.).